
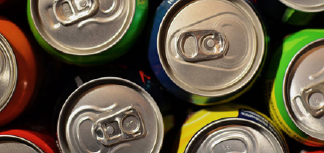
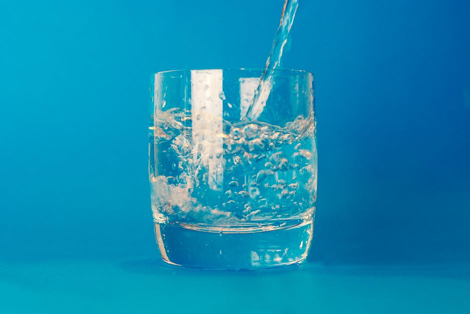
For the first time in decades, Americans are buying more bottled water than any other beverage. This milestone occurred in 2016 as bottled water sales surpassed that of the second largest category: carbonated soft drinks. Many attribute this shift in consumer choice to growing health concerns about the effects of beverages with added sugar.1
The Largest Source of Added Sugars in the American Diet
Sugar-sweetened beverages (SSBs) are linked to an ever-growing list of health problems including obesity, type 2 diabetes, high blood pressure, coronary heart disease, gout, kidney disease, liver disease, and tooth decay.2-4 New findings about these dangers have prompted leading health organizations like the World Health Organization and the American Heart Association to issue advisory statements about their harms, urging reduced consumption of SSBs.5,6
What are Sugar-Sweetened Beverages?
Sugar-sweetened beverages (SSBs) include any non-alcoholic beverage with added caloric sweeteners or sugars, such as cane sugar or high-fructose corn syrup.7 These include:
- Sodas and soft drinks
- Sweetened coffees and teas
- Sports drinks and energy drinks
- Fruit drinks, and
- Sweetened waters
SSBs are the largest source of added sugars in the American diet.8 Among adolescents, one-fifth of calories come from beverages.9 In fact, it is estimated that adolescents consume an average of 39 pounds of sugar each year from SSBs alone.10
Putting a Cap on the Problem
Despite a shift in sales from SSBs to healthier beverage options, rates of overweight, obesity, and chronic diseases continue to rise across the country and around the world. As a response, governmental and health advocacy groups are calling for policy approaches to promote healthier beverage choices.5,6,9,11
Many local and national governments have passed excise taxes, usually in cents per ounce. Six U.S. cities and one U.S. county have passed and maintained taxes on SSBs.12 The Navajo Nation has passed a SSB tax as part of a “junk food” tax.13 Hungary, France, and most recently Mexico have done the same.6 And these taxes have produced the desired results. Research has shown that a 10 percent price increase is enough to decrease SSB consumption by 12 percent.14
Creation of such taxes are met with plenty of opposition from the beverage industry, labor groups, lawmakers, and voters themselves. At least two states passed SSB taxes, only to repeal them a year or two later, and over 30 cities and states unsuccessfully attempted to pass their own versions of SSB taxes.12,13
Recycling Good Ideas
For organizations and local governments who wish to do their part in making healthy choices easier and more convenient for their employees and citizens, a variety of policy tools exist to accomplish this.
Some recent successes include restricting the marketing and sales of SSBs in schools and child care or after-school programs. Others have included policies promoting healthier options in vending machines and food services in public recreation areas, government buildings, corporate workplaces, clinics and hospital systems.15 Additionally, several cities have passed policies requiring restaurants to serve water, milk, or 100 percent juice as the default drink, rather than soda, in any kids’ meal.16
Bills requiring warning labels on packaging are in the works in several states. These have been shown to be an effective strategy for reducing SSB consumption among adolescents.17,18 Other strategies, such as beverage size limits, proportional pricing, and retailer licensing, are on the horizon.15,18
California Senate Bill 300 (Monning)
Introduced in February 2017, Senate Bill 300 would require safety warnings on all sealed SSB containers.19 Supporters of this bill include:
- American Academy of Pediatrics
- American Cancer Society Cancer Action Network
- American Diabetes Association
- American Heart Association/American Stroke Association
- California Academy of Nutrition and Dietetics
- California Nurses Association
- 62 other organizations, counties, cities, and individuals
Opponents of the bill include:
- American Beverage Association
- California Teamsters
- 21 other trade associations, chambers of commerce, and other organizations20
Changing the Formula
It is a paradox that communities suffering from hunger actually consume higher amounts of sugar-sweetened beverages.21,22 This paradox may have everything to do with pricing and availability of these products when compared to healthier options.
In 2012, the Institute of Medicine published a report calling for the creation of “food and beverage environments that ensure that healthy food and beverage options are the routine, easy choice.” Specifically, the report called for more competitive pricing of healthier foods and beverages. If policy makers do not have an appetite for soda taxes, they must at least acknowledge that the existing food and beverage environment must be changed for the better.23

Marcus Heisler, MD
Marcus Heisler, MD, is a resident physician in the combined Family and Preventive medicine residency program at Loma Linda University and a Population Medicine student in the School of Public Health
- Press Release: Bottled Water Becomes Number-One Beverage in the U.S. In: Beverage Marketing Corporation [Internet]. 10 Mar 2017 [cited 12 Sep 2017]. Available: http://www.beveragemarketing.com/news-detail.asp?id=438
- Malik VS, Popkin BM, Bray GA, Després J-P, Hu FB. Sugar-sweetened beverages, obesity, type 2 diabetes mellitus, and cardiovascular disease risk. Circulation. 2010;121: 1356–1364.
- Bomback AS, Derebail VK, Shoham DA, Anderson CA, Steffen LM, Rosamond WD, et al. Sugar-sweetened soda consumption, hyperuricemia, and kidney disease. Kidney Int. 2010;77: 609–616.
- Bernabé E, Vehkalahti MM, Sheiham A, Aromaa A, Suominen AL. Sugar-sweetened beverages and dental caries in adults: a 4-year prospective study. J Dent. 2014;42: 952–958.
- SSB Tax Policy - Position Statement [Internet]. American Heart Association; 2016 Jun. Available: https://www.heart.org/idc/groups/ahaecc-public/@wcm/@global/documents/downloadable/ucm_490766.pdf
- WHO technical staff. Reducing consumption of sugar-sweetened beverages to reduce the risk of unhealthy weight gain in adults. In: World Health Organization [Internet]. World Health Organization; Sep 2014 [cited 13 Sep 2017]. Available: http://www.who.int/elena/titles/bbc/ssbs_adult_weight/en/
- Warning Labels on Sugary Drinks [Internet]. American Heart Association; Available: https://www.heart.org/idc/groups/ahaecc-public/@wcm/@adv/documents/downloadable/ucm_482397.pdf
- Huth PJ, Fulgoni VL, Keast DR, Park K, Auestad N. Major food sources of calories, added sugars, and saturated fat and their contribution to essential nutrient intakes in the U.S. diet: data from the National Health and Nutrition Examination Survey (2003-2006). Nutr J. 2013;12: 116.
- Miller G, Merlo C, Demissie Z, Sliwa S, Park S. Trends in Beverage Consumption Among High School Students - United States, 2007-2015. MMWR Morb Mortal Wkly Rep. 2017;66: 112–116.
- Babey SH, Jones M, Yu H, Goldstein H. Bubbling over: soda consumption and its link to obesity in California. Policy Brief UCLA Cent Health Policy Res. 2009; 1–8.
- World Health Organization. Guideline: Sugars intake for adults and children. Geneva: World Health Organization; 2015.
- Paarlberg R, Mozaffarian D, Micha R. Viewpoint: Can U.S. local soda taxes continue to spread? Food Policy. 2017;71: 1–7.
- Barclay E. Navajos Fight Their Food Desert With Junk Food And Soda Taxes. In: NPR.org [Internet]. 1 Apr 2015 [cited 13 Sep 2017]. Available: http://www.npr.org/sections/thesalt/2015/04/01/396607690/navajos-fight-their-food-desert-with-junk-food-and-soda-taxes
- Powell LM, Chriqui JF, Khan T, Wada R, Chaloupka FJ. Assessing the potential effectiveness of food and beverage taxes and subsidies for improving public health: a systematic review of prices, demand and body weight outcomes. Obes Rev. 2013;14: 110–128.
- Sugar-sweetened Beverages Playbook [Internet]. ChangeLab Solutions; 2013 Sep. Available: http://www.changelabsolutions.org/sites/default/files/SSB_Playbook_FINAL-20131004.pdf
- Healthy Default Drinks in Kids’ Meals | Kick the Can [Internet]. [cited 13 Sep 2017]. Available: http://www.kickthecan.info/healthy-default-drinks-kids%E2%80%99-meals
- VanEpps EM, Roberto CA. The Influence of Sugar-Sweetened Beverage Warnings: A Randomized Trial of Adolescents’ Choices and Beliefs. Am J Prev Med. 2016;51: 664–672.
- Sugary Drink Legislation | Kick the Can [Internet]. [cited 6 Sep 2017]. Available: http://www.kickthecan.info/legislative-campaigns
- Monning S. SB-300 Sugar-sweetened beverages: health warnings [Internet]. Sect. 111224, SB300 Feb 13, 2017. Available: http://leginfo.legislature.ca.gov/faces/billNavClient.xhtml?bill_id=201720180SB300
- Diaz R. Bill Analysis: SB 300. California Senate Committee on Health; 2017.
- Tomayko EJ, Mosso KL, Cronin KA, Carmichael L, Kim K, Parker T, et al. Household food insecurity and dietary patterns in rural and urban American Indian families with young children. BMC Public Health. 2017;17: 611.
- Becerra MB, Hassija CM, Becerra BJ. Food insecurity is associated with unhealthy dietary practices among US veterans in California. Public Health Nutr. 2016; 1–8.
- Accelerating Progress in Obesity Prevention: Solving the Weight of the Nation [Internet]. Institute of Medicine; 2012 May. Available: http://www.nationalacademies.org/hmd/~/media/Files/Report%20Files/2012/APOP/APOP_rb.pdf
Did you like this article? We want to hear from you! Leave your comments or questions in the space below.
The views expressed in this article do not necessarily represent those of Loma Linda University Health or the Institute for Health Policy and Leadership.